


Introduction
NetSuite is a powerful cloud-based Enterprise Resource Planning (ERP) software that offers various tools for managing and analysing your business data. One of its key features is the ability to create custom analytics datasets and workbooks, enabling you to gain valuable insights into your business operations. In this blog post, we’ll walk you through the process of creating a NetSuite analytics dataset and workbook to create a pivot table, and bar chart to display sales by month for the current fiscal year.
Step 1: Accessing NetSuite Analytics
To get started, log in to your NetSuite account and navigate to the Analytics tab in the top menu bar. This is where you’ll create your custom analytics dataset and workbook.
Step 2: Create a New Dataset
- Click on the “New Dataset” button to create a new analytics dataset.
- Select the data source that contains your sales order data. You can use one of two dataset record types as the basis of this reporting in Analytics. For this example, we are going to use the Sales (Ordered) dataset.
- Sales (Ordered) – Prebuilt Analytical dataset which includes all Sales Orders and Return Authorizations only including transaction line detail.
- Transactions – This standard dataset includes all transaction types and can be filtered to include only the sales transaction types you wish to include in your output.
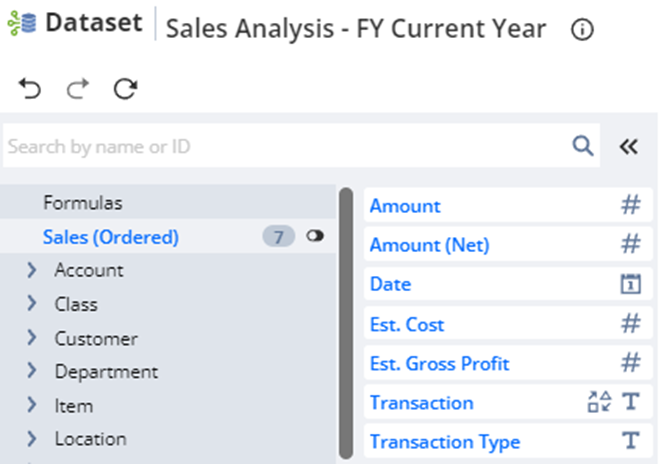
- Choose the fields you want to include in your dataset.
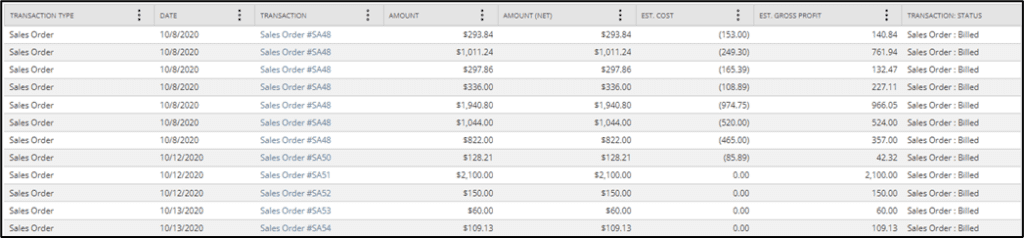
For this analysis, we are going to include only the following fields in our dataset because we are looking to generate an aggregate sales summary by period and not item or customer detail:
- Transaction Type
- Date
- Transaction (Document Number)
- Amount
- Amount (Net)
- Est. Cost
- Est. Gross Profit
- Transaction Status
- Set the date range to “Current Fiscal Year” to ensure you’re analyzing data only for the current fiscal year. To do this, you can either drag and drop the Date field from the selected fields list or directly from the dataset grid label to the Criteria filter region at the top of the dataset page.
- This will open a new Filter Date form.
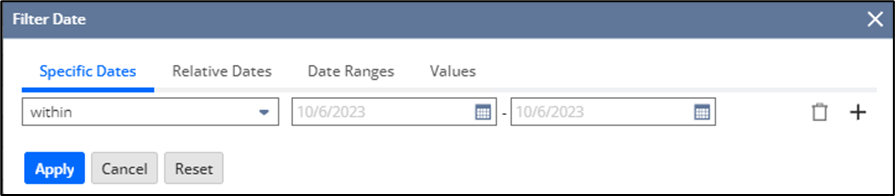
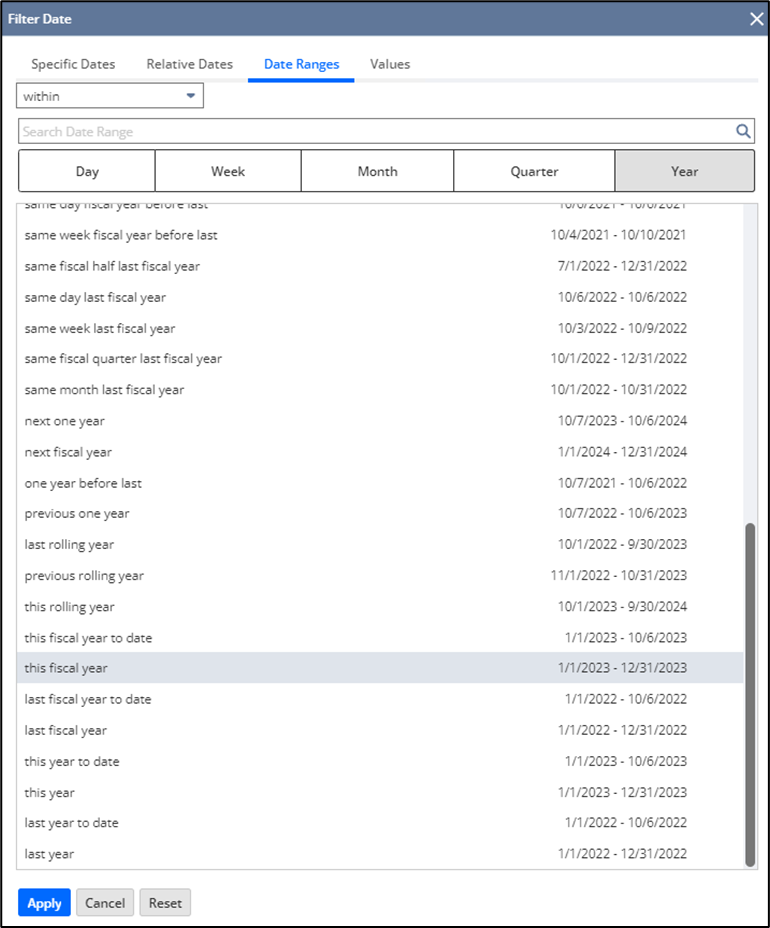
- Select “Date Ranges”.
- Select “Year”.
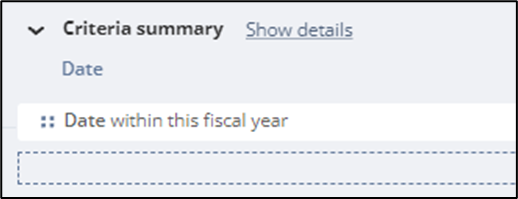
- Select “this fiscal year” and click Apply.
You will now see the filter criteria displayed in the Criteria Summary box above the data grid in the Data Set.
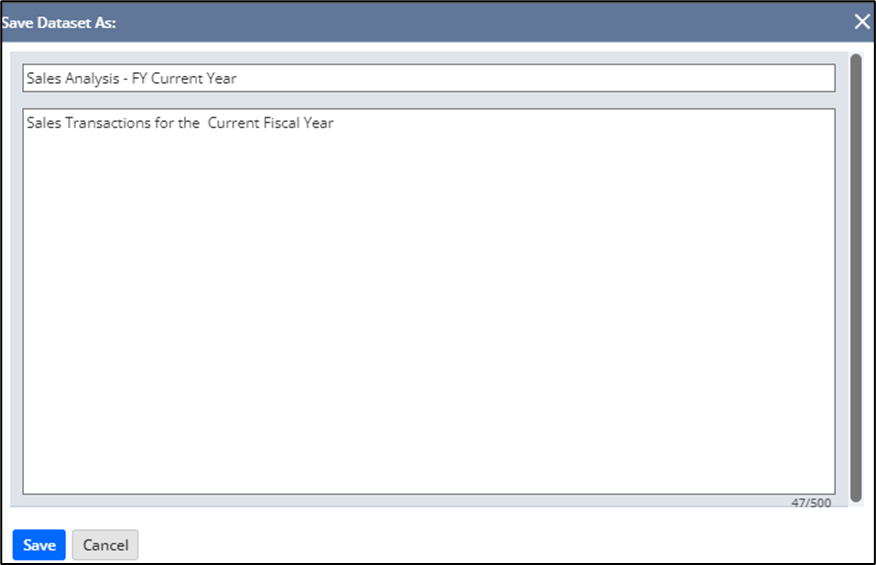
- Click “Create” to save your dataset.
- Name your dataset something relevant like “Sales Analysis – FY Current Year.”
Step 3: Create a Workbook
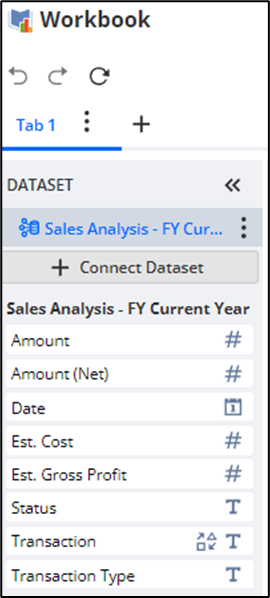
- After creating the dataset, click on the “Apply to workbook” button to create a new analytics workbook that is connected to this data set.
You will notice that the workbook contains only the fields that were selected to be used in the dataset we just created.
- Give your workbook a meaningful name, such as “Sales Analysis Workbook – FY Current Year.” To do this, click on the information icon next to the default Workbook name at the top of the page and then click on the pencil icon next to the Workbook Name field.
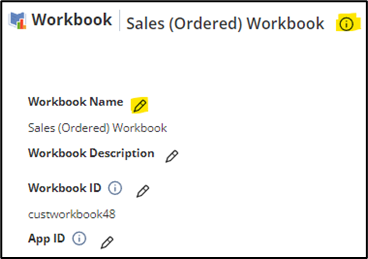
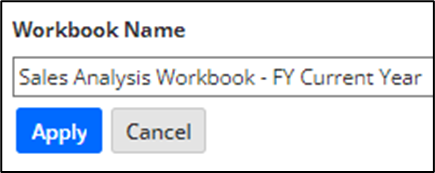
- Click the Apply button.
Step 4: Create a Pivot Table
A pivot table is a dynamic tool that allows you to analyze your data from various angles.
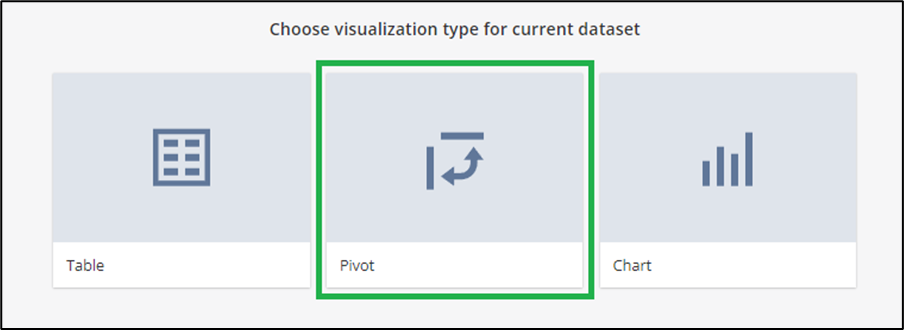
- From your workbook, select “Pivot Table” from the list of visualization types available. This will open a pivot table layout screen.
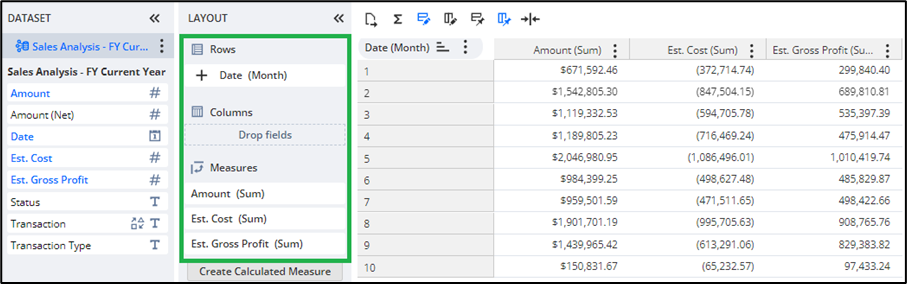
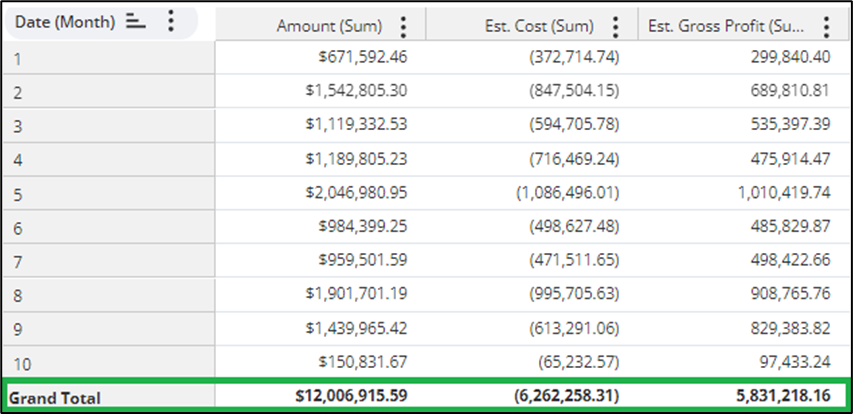
- Configure your pivot table with Date (Month) as rows and Sales Amount, Est. Cost and Est. Gross Profit as Measures.
- Click on the Sum icon from the menu above the pivot table results and select the bottom to display a grand total row at the bottom of the pivot table.
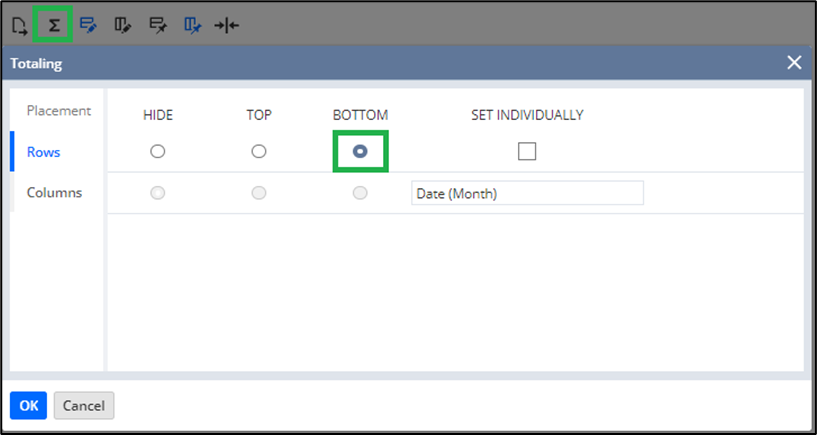
- Click OK to apply the changes to the pivot table.
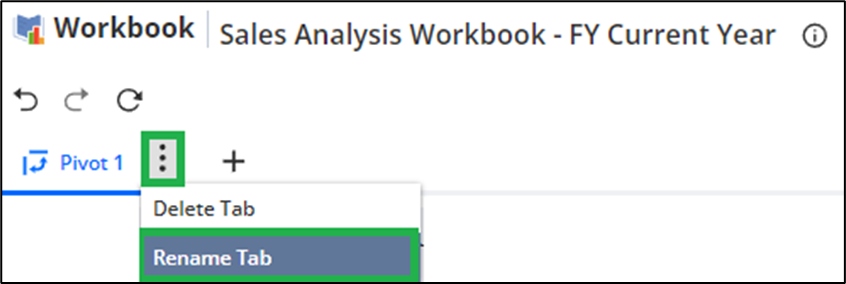
- Rename the tab associated to this pivot table and give it a meaningful title such as “Sales Totals by Month – This Year”.
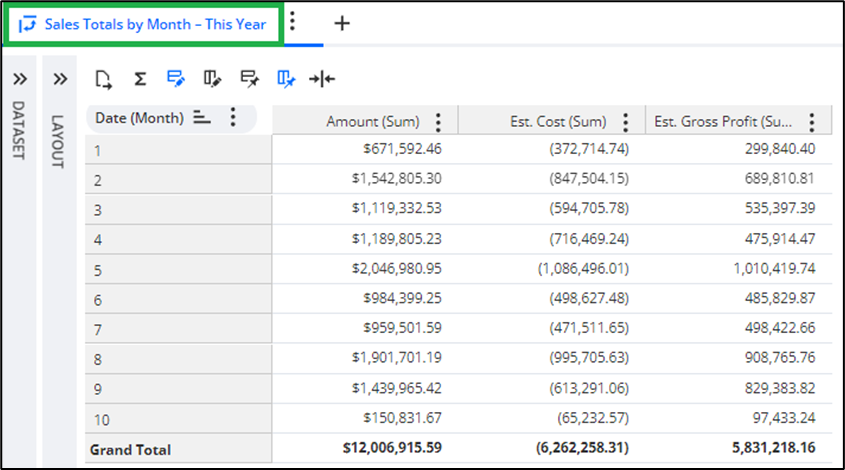
- Click the Save button to save the workbook.
Step 5: Create a Bar Graph
A bar graph is an effective way to visualize your sales data over time.
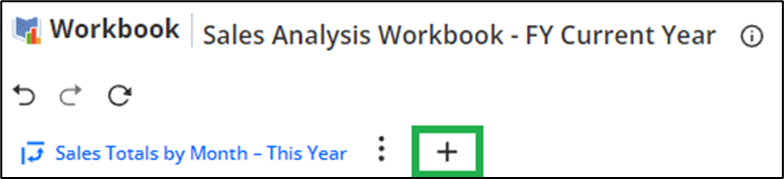
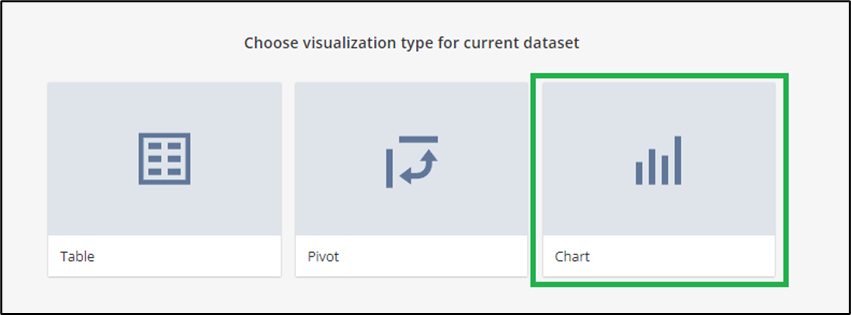
- Inside your workbook, click on the “Add Content” button.
- Select “Chart” from the list of visualization types.
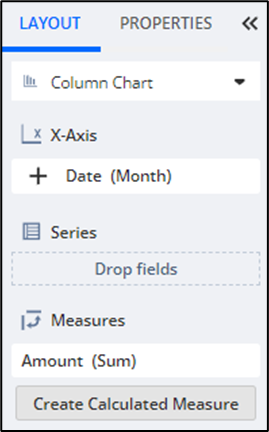
- Under Layout, select “Column Chart” as the Chart Type.
- Assign Date (Month) as the X-axis.
- Assign Sales Amount as the Measures.
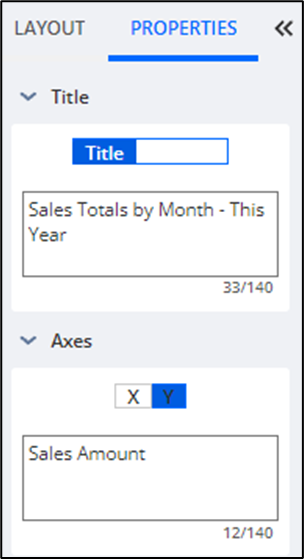
- Customize your bar graph’s appearance and labeling as needed. You can add Titles and labels for each axis on the Properties tab.
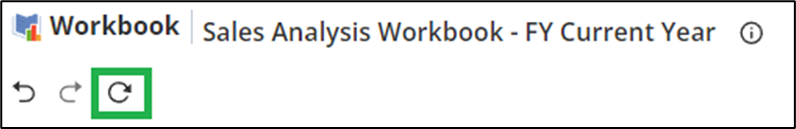
- Refresh the Chart data by clicking on the Refresh icon above Workbook tabs.
When you are done, you will now have a dynamic and interactive Chart in your Analytics workbook.
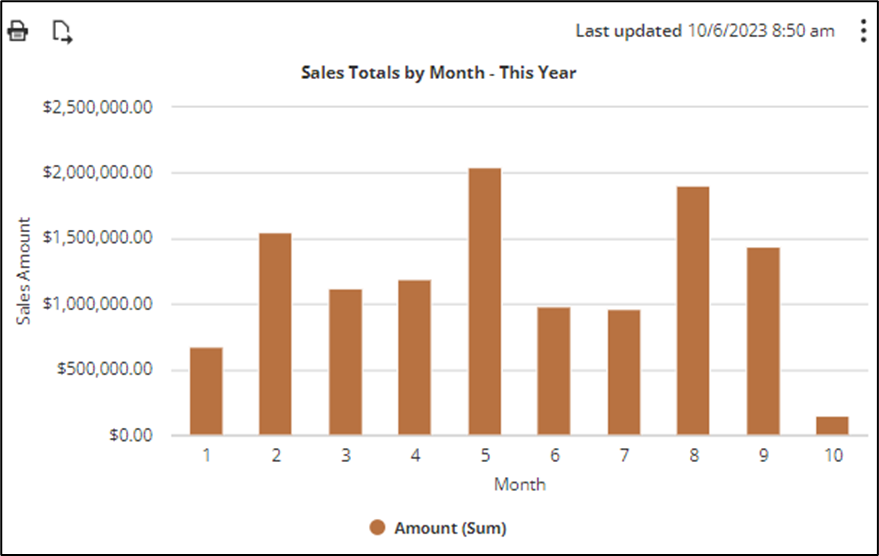
- Rename your Chart workbook tab and give it a meaningful title such as “Sales Totals by Month – Bar Chart”.
Step 6: Save and Share Your Workbook
Once you’ve created your pivot table, and bar graph, make sure to save your workbook. You can also share it with relevant team members or schedule automated updates for timely insights.
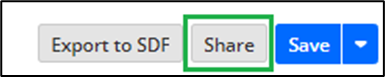
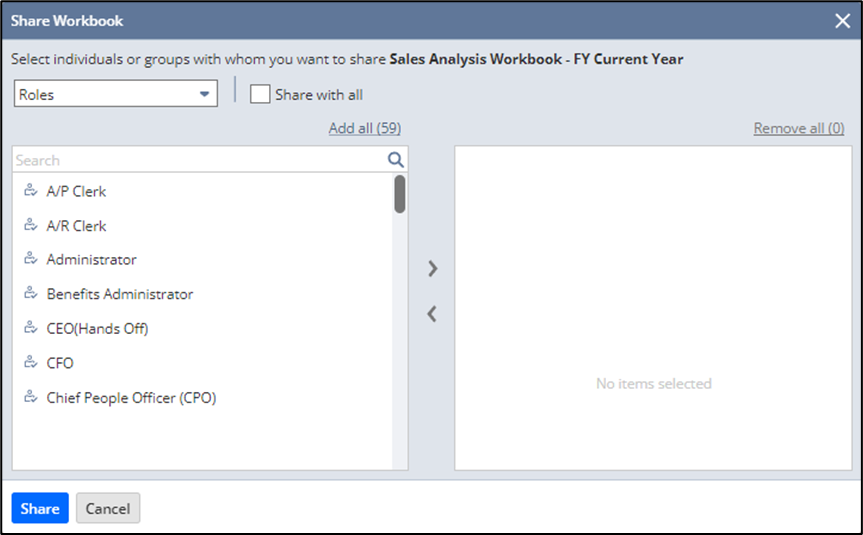
- Click on the Share button on the top right of the Workbook.
- Select the Role(s) or Employees you wish to Share access to this workbook with and click Save.
Conclusion
Creating NetSuite analytics datasets and workbooks to analyze data is an extremely powerful way to gain insights into your business’s financial performance as well as visualize data in different and meaningful ways. By following these steps, you can harness the power of NetSuite’s analytics tools to make informed decisions and drive your business forward.If you need further assistance regarding the above mentioned steps, then do connect with NetSuite experts and ask them, they will be happy to help you in every way possible.
About Us
We are a NetSuite Solutions Partner and reseller with 30+ years of combined experience. We specialize in implementation, optimization, integration, rapid project recovery and rescue as well as custom development to meet any business need. If you would like more information on NetSuite or are in need of consultation for your project or implementation, feel free to contact NetSuite support.
To Contact Us ClickHere