


Introduction
NetSuite offers a comprehensive suite of tools designed to help you create customized dashboards and reports that align with your unique business needs. Whether you are looking to track key performance indicators, analyze financial data, or monitor operational metrics, NetSuite Services provides the flexibility and functionality to build robust, insightful dashboards and reports.
In this guide, we will take you through the step-by-step process of configuring these dashboards and reports in NetSuite, ensuring that you can make informed decisions and drive your business forward with confidence. From setting up critical data visualizations to customizing reports for different departments, you’ll learn how to leverage NetSuite’s capabilities to their fullest potential.
Creating a Dashboard
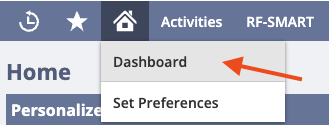
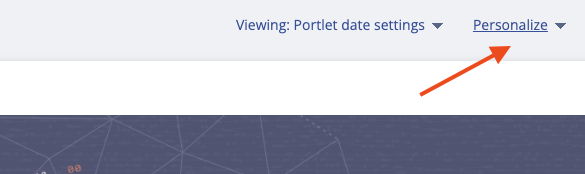
Navigate to Home > Dashboard > Personalize.
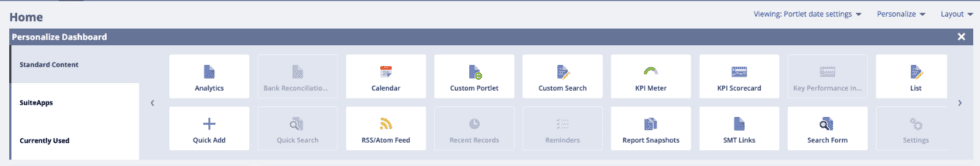
Add Portlets
- Select the type of portlet you want to add (e.g., KPI, Chart, List, Report).
- Configure the portlet settings such as data source, filters, and display options.
Arrange Portlets:
- Drag and drop portlets to arrange them on your dashboard.
Save and Share:
- Share your dashboard with other users or roles by Publishing it. When you publish a dashboard, you can define the roles of the users who can see it and what changes they can make
Creating Custom Reports
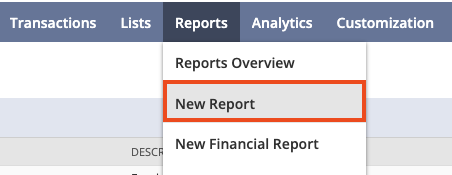
Navigate to the Report Builder:
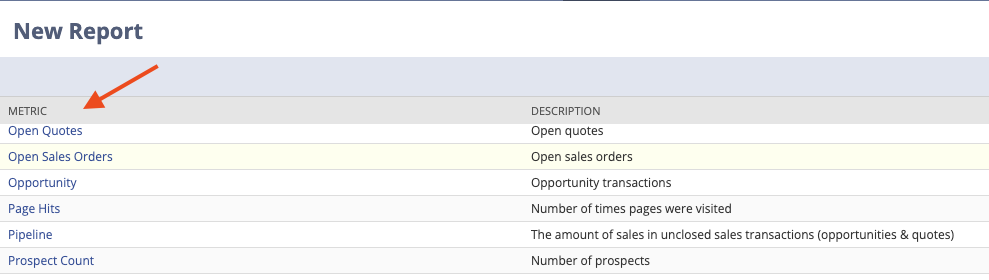
- Go to Reports > New Report
- Select the Metric for your report (e.g., Sales Orders, Customers).
Configure Report Settings:
- Select the fields you want to include in your report.
- Apply filters to narrow down the data (e.g., date range, status).
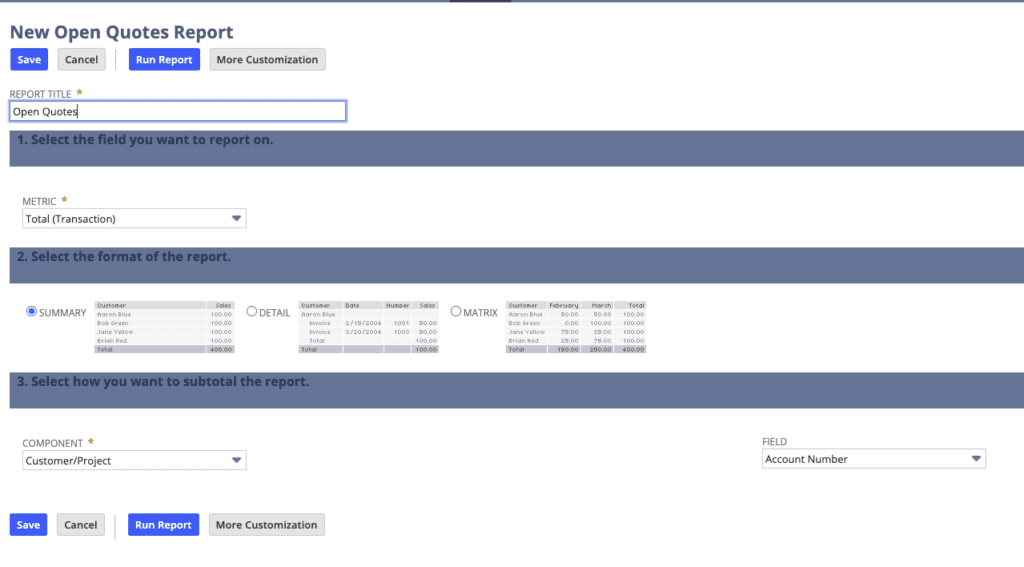
Save and Run Report:
- Click on “Save As” to save your report with a unique name.
- Run the report to view the data based on your configuration.
Adding Reports to Dashboards
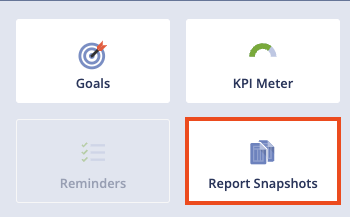
- Navigate to your dashboard and click on Report Snapshot.
- Choose the saved report you want to add to your dashboard.
- Configure the report settings such as display options and filters.
Tips for Effective Dashboards and Reports
- Focus on Key Metrics: Include only the most relevant and important data on your dashboard.
- Use Visualizations: Use charts and graphs to make data easier to understand at a glance.
- Regularly Review and Update: Update your dashboards and reports as your business needs change.
- Share Insights: Use dashboards and reports to share insights and drive decision-making in your organization.
Conclusion
By following these steps, you can configure useful Dashboards and Reports in NetSuite to effectively track and analyze your business data. This process will enable you to gain valuable insights, identify trends, and make informed decisions based on real-time information. Additionally, these customized Dashboards and Reports can be tailored to meet the specific needs of various departments, providing key stakeholders with the visibility they need to monitor performance and achieve strategic objectives. Utilizing NetSuite dashboard customization will help you to enhance the relevance of your data visualizations. As a result, you’ll be better equipped to optimize operations, drive growth, and enhance overall business efficiency. Embracing these tools will not only improve your data management capabilities but also empower your team to proactively address challenges and seize opportunities in a dynamic business environment.
About Us
We areNetSuite Solutions Providerswith 30+ years of combined experience. We specialize in NetSuite Consulting, implementation, optimization, integration, rapid project recovery and rescue, and custom development to meet any business need. Although every business is unique, with 40+ NetSuite clients over the last 5+ years, our NetSuite Consultants have most likely seen your challenge or created a similar solution. If you would like more information on NetSuite or just have questions about your project,feel free to contact usHere.