


Introduction
Tracking customer sales performance over time is critical for understanding revenue trends, identifying growth opportunities, and making informed business decisions. Recently, our team explored the best approach to building a Customer-Level Monthly Sales Comparison Report in NetSuite. This type of NetSuite sales report allows you to analyze monthly sales by customer, compare year-over-year sales data, and gain insights into customer buying patterns. Here’s what we learned about creating effective sales comparison reports in NetSuite.
The Business Need
The goal was straightforward: provide a report that shows monthly sales dollars by customer and allows for comparisons across previous years. At first glance, this seems like something a simple saved search could handle, but as we discovered, there’s a bit more nuance when you need month-to-month comparisons over multiple years.
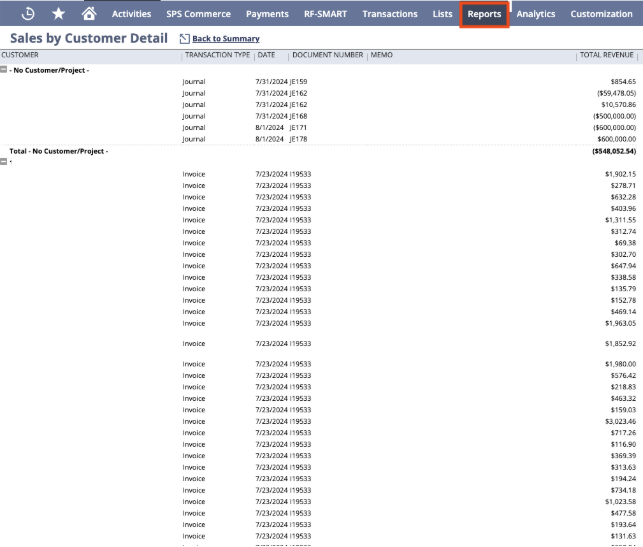
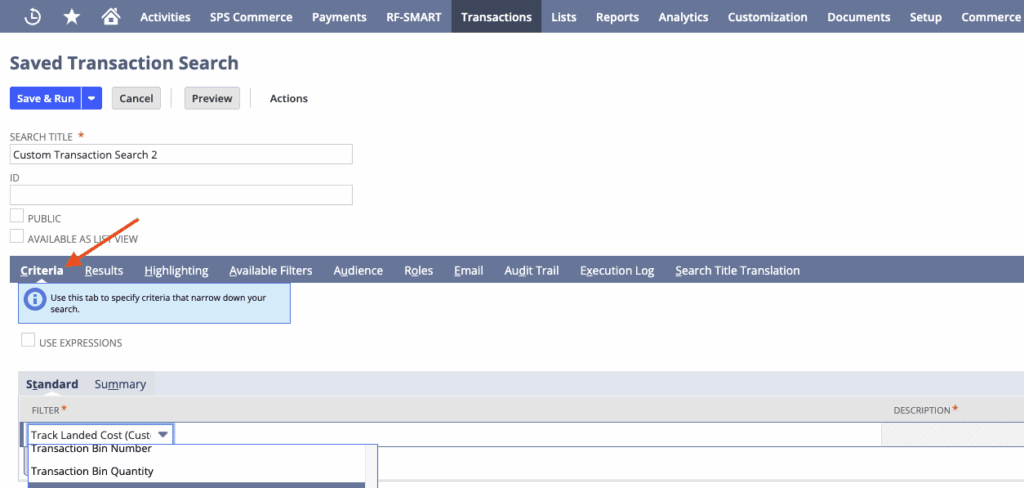
Why Saved Searches and Reports Aren’t Enough
Saved searches in NetSuite are excellent for many reporting needs, but they have limitations for this type of analysis:
- They are date range-driven, meaning you can filter a specific period but can’t easily compare the same month across different years.
- They don’t allow for multiple columns by year; you can only group data in rows.
- Filtering by multiple conditions (e.g., this year, last year, and a specific month) isn’t straightforward.
In short, if your goal is to see month-over-month performance across years at the customer level, saved searches alone won’t deliver the full picture.
EX:
EX:
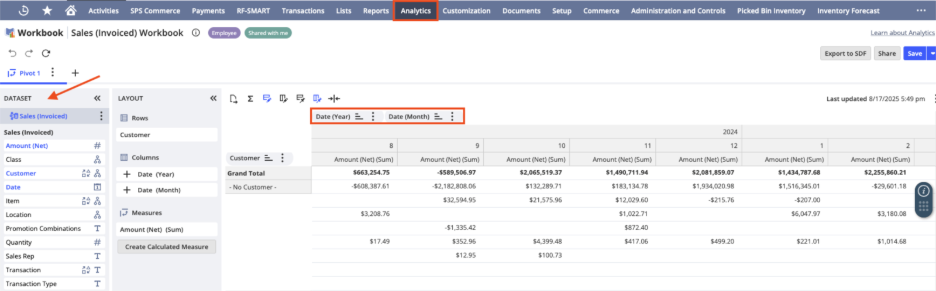
Leveraging NetSuite Analytics
This is where NetSuite Analytics Workbooks come in. Workbooks provide the flexibility needed for multi-year, month-level comparisons:
- Pivot Table Structure: You can pivot by month, customer, and year, making it easy to compare data side by side.
- Custom Filters: Apply filters for specific months, years, or customer groups.
- Transaction-Level Analysis: Use invoices and cash sales to ensure all revenue types are captured accurately.
For example, if you want to compare August 2024 and August 2025, you can filter your dataset by the month “August” and include both years in your workbook. Once set up, the workbook will dynamically show month-over-month comparisons for each customer.
Steps to Build the Report
- Create a Dataset: Start with a dataset based on transaction types like invoices and cash sales. Include fields for customer, transaction date, and amount.
- Filter by Year and Month: Apply filters to show the months and years you want to compare.
- Use Pivot Tables: Group data by customer and month, and display sales figures by year in separate columns.
- Share and Iterate: Share the workbook with stakeholders (like executives or finance) to confirm it meets their needs before deploying in production.
Conclusion
By leveraging NetSuite Analytics Workbooks and advanced NetSuite reporting tools, you can create robust, flexible reports that deliver clear insights into customer-level monthly sales trends. These sales comparison reports help identify revenue patterns, track year-over-year performance, and highlight growth opportunities. With accurate NetSuite sales analytics, your team is empowered to make smarter, data-driven business decisions that drive long-term success.
About Us
We areNetSuite Solutions Providerswith 30+ years of combined experience. We specialize in implementation, optimization, integration, rapid project recovery & rescues, and custom development to meet any business need. Although every business is unique, serving over 40 NetSuite clients during the last 6 years our NetSuite Consulting team has most likely seen your challenge and created a similar solution. For more information on NetSuite solutions or questions about your project contact usHere.