Introduction
NetSuite’s financial reporting tools are powerful assets for companies looking to gain insight into their financial performance. In this blog, we’ll explore the main types of financial reports available in NetSuite, what they reveal about your business, and how to navigate them effectively.
Types of Financial Reports in NetSuite
NetSuite offers a broad range of pre-built financial reports, tailored to address various aspects of a company’s financial health. Here’s a breakdown of the main types:
1. Income Statement (Profit & Loss)
- What it does: The Income Statement, also known as the Profit & Loss (P&L) statement, provides a snapshot of a company’s revenues and expenses over a specified period. It calculates net income by subtracting expenses from revenues, giving insight into profitability.
- Uses: Companies use this report to monitor profitability, assess cost structure, and track revenue trends over time. It’s often reviewed monthly or quarterly by management and stakeholders.
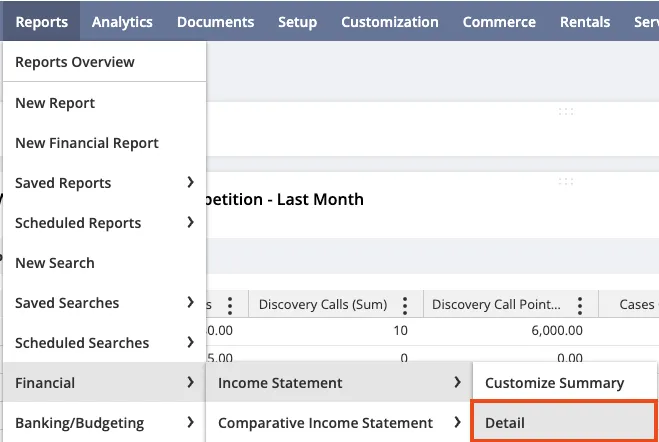
- How to navigate: Navigate to Reports > Financial > Income Statement. From here, you can customize the date range, filter by department, class, or location, and save the report for recurring use.

2. Balance Sheet
- What it does: The Balance Sheet displays a company’s assets, liabilities, and equity at a specific point in time. It shows what the company owns versus what it owes, helping assess financial stability.
- Uses: A Balance Sheet is essential for understanding liquidity, solvency, and financial leverage. It’s particularly useful for internal audits, investor relations, and making informed financial decisions.
- How to navigate: Go to Reports > Financial > Balance Sheet, where you can adjust filters like subsidiary (if using OneWorld), location, or specific account classifications. The report can be saved and shared with team members or exported for deeper analysis.

3. Cash Flow Statement
- What it does: The Cash Flow Statement breaks down cash inflows and outflows into operating, investing, and financing activities. It’s a crucial report for understanding cash availability and forecasting future cash needs.
- Uses: This report helps financial managers ensure the business has sufficient cash to cover expenses and make investment decisions. It’s invaluable for managing liquidity and avoiding potential cash shortages.
- How to navigate: Access this report by navigating to Reports > Financial > Cash Flow Statement. Customize the reporting period and, if necessary, add filters by location or department for a more segmented analysis.
4. Trial Balance
- What it does: The Trial Balance report provides a summary of all general ledger accounts, listing their ending balances at a particular date. This report is critical in the accounting cycle to ensure debits equal credits.
- Uses: It helps accountants verify the accuracy of financial entries, diagnose discrepancies, and perform reconciliations prior to generating final reports.
- How to navigate: Find the report under Reports > Financial > Trial Balance. Adjust the date range to capture transactions up to the current period for balancing verification.

5. General Ledger
- What it does: The General Ledger (GL) report is a comprehensive record of all financial transactions for each account, detailing individual debits and credits.
- Uses: Financial controllers and accountants use the GL report for auditing, ensuring compliance, and analyzing specific account activities in detail.
- How to navigate: Head to Reports > Financial > General Ledger. Customize filters by date, subsidiary, and location to narrow down the report’s focus. The report can be saved and easily exported for cross-departmental reviews.

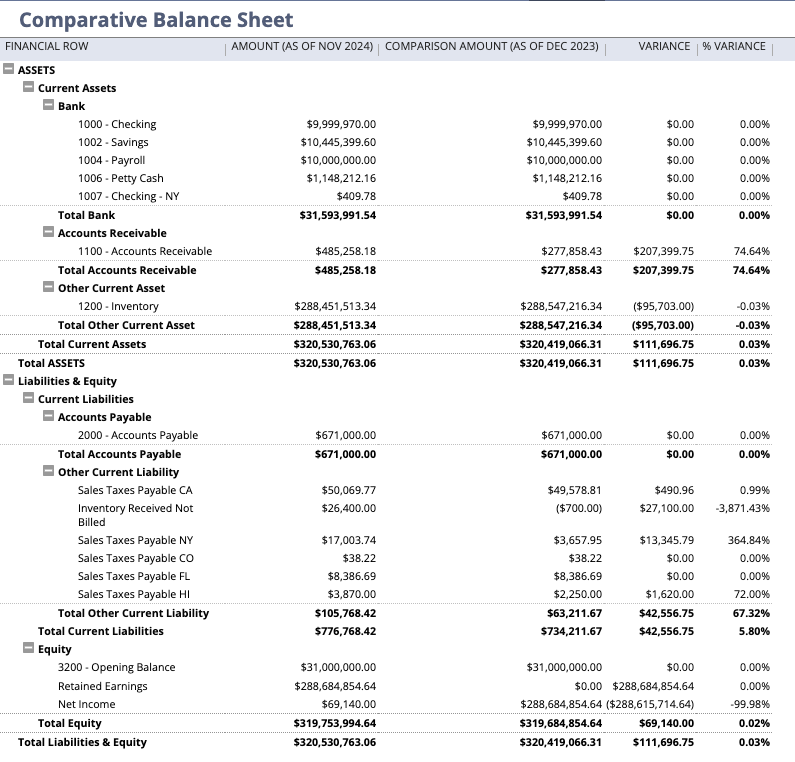
6. Comparative Balance Sheet
- What it does: Displays account balances over multiple periods: It shows the financial position of a business, broken down by assets, liabilities, and equity, across chosen time periods.
- Uses: Helps identify long-term trends in financial accounts, such as whether certain assets or liabilities are growing or shrinking.
- How to navigate: Go to Reports > Financial > Comparative Balance Sheet. If you do not see this, check with your administrator, as report access can be restricted based on roles. Select your periods for comparison: Typically, NetSuite allows you to choose specific dates or periods, such as “Previous Period” or “Previous Year.”

Navigating and Customizing Financial Reports in NetSuite
Navigating NetSuite’s financial reporting tools is straightforward, but making the most of them often involves customization:
- Customizing Reports
Customizing reports in NetSuite allows you to tailor them to your unique business needs. In any report view, click on Customize, and adjust options such as:
- Date ranges – Select from predefined periods or set custom ranges.
- Filters – Add or remove filters by departments, locations, classes, or other categories.
- Column Layouts – Rearrange or add columns to show different data points.
- Formula Fields – Create new fields for calculations directly in the report view.
- Saving Custom Reports
Once you’ve customized a report, you can save it for future use. In the report editor, click Save As to create a new custom report definition. You can even schedule it to be delivered to specific users automatically.
- Exporting and Sharing Reports
Reports in NetSuite can be exported as PDF, Excel, or CSV files. This makes it easy to share with stakeholders or incorporate into presentations. To export, simply click on the Export button at the top of the report view.
- Scheduling Reports
For reports that need regular review, NetSuite allows scheduling. When viewing a report, click Schedule, choose the frequency (daily, weekly, monthly), and select recipients to ensure everyone gets the insights they need on time.
- Using Report Snapshots on Dashboards
Report snapshots are visual summaries of your most crucial reports. Add these to your dashboard by clicking Personalize on your dashboard, selecting Report Snapshots, and choosing the report you want to display. This allows you to keep critical KPIs at your fingertips.

Conclusion
Navigating financial reports in NetSuite is an empowering skill for anyone responsible for monitoring and managing finances. With a range of customizable reports and real-time data, NetSuite provides a flexible framework that can grow with your business. Whether it’s tracking revenue, managing cash flow, or consolidating global finances, NetSuite’s robust reporting tools keep your business on the right financial path. Watch the video below to see a demo of navigating NetSuite Financial Reports.
About Us
We areNetSuite Solutions Providerswith over 30 years of combined experience. Our team specializes in implementation, optimization, integration, rapid project recovery, and custom development to meet any business need. With more than 40 NetSuite clients over the past five years, we have likely encountered challenges similar to yours and developed effective solutions. If you would like more information about NetSuite or have questions about your project, feel free to contact ushere.

